Home
G2 Team 10: The Cost of Coast?
Thomson-East Coast line project under the module SMT201 Geographic Information Systems for Urban Planning by Professor Kam Tin Seong in Singapore Management University (SMU).
The name ‘The Cost of Coast?’ came about because we were pondering if the cost of building the stage 4 of TEL MRT stations is truly worth it. In this project website, dive into our findings using various QGIS approaches to find out what benefits are reaped from the construction of these new stations.
Introduction
With over 148 km of rail across 106 stations and an estimated 3 million commuters. First open to passengers in 1987, the MRT had actually been a long time coming, with planning done as early as the 1960s. The main objective of building the MRT was to have a better road network for Singaporeans and create a more efficient public transport system to cope with the increasing population.
In 1972, consultants and officers started the SG Mass Transit study, in which they recommended an investment in public transport to cope with the travel demands and avoid traffic congestion as it started to worsen. In the second phase, they recommended a bus-rail system rather than an all-bus system. However, it was a dilemma because constructing an MRT system had high costs, impacts on land use and economic activities. In 1982, the government found that SG would benefit greatly from an MRT system and decided to build and finance the $5 billion project.
Main objectives for building MRT in the past
Cope with increasing population
Ease traffic congestion
Better road network
The main objectives for building the TEL:
to “bring residents in the east and along the North-South Corridor closer to a train station and hence giving them faster & more direct access to the city”, as per lta.gov.sg.
When the TEL opens over the next few years, more than 240,000 households will be within a 10-minute walk from a TEL station
TEL will transport an initial amount of 500,000 commuters, gradually increasing to 1 million commuters in the future.
Project motivation
In the 1960s, the main objective of building MRT was to have a better road network and an efficient public transport system for Singaporeans to cope with the increasing population. After much progress in the development of the rail-way system today,the Government announced a $87.5 billion in 2020to fund rail-way projects in the next decade, with the Thomson- East Coast line completed and running by 2023. Main objective is to “bring residents in the east and along the North-South Corridor closer to a train station and hence giving them faster & more direct access to the city” (lta.gov.sg). However, constructing a MRT system had high cost, impacts on land use and structural integrity of the buildings around it.
Problem statement:
This project aims to find out what facilities and land use plans are covered within the catchment areas of the 7 upcoming TEL MRT stations and whether there is true necessity to invest such a huge sum into Singapore’s already world-renowned rail system.
Project study area:
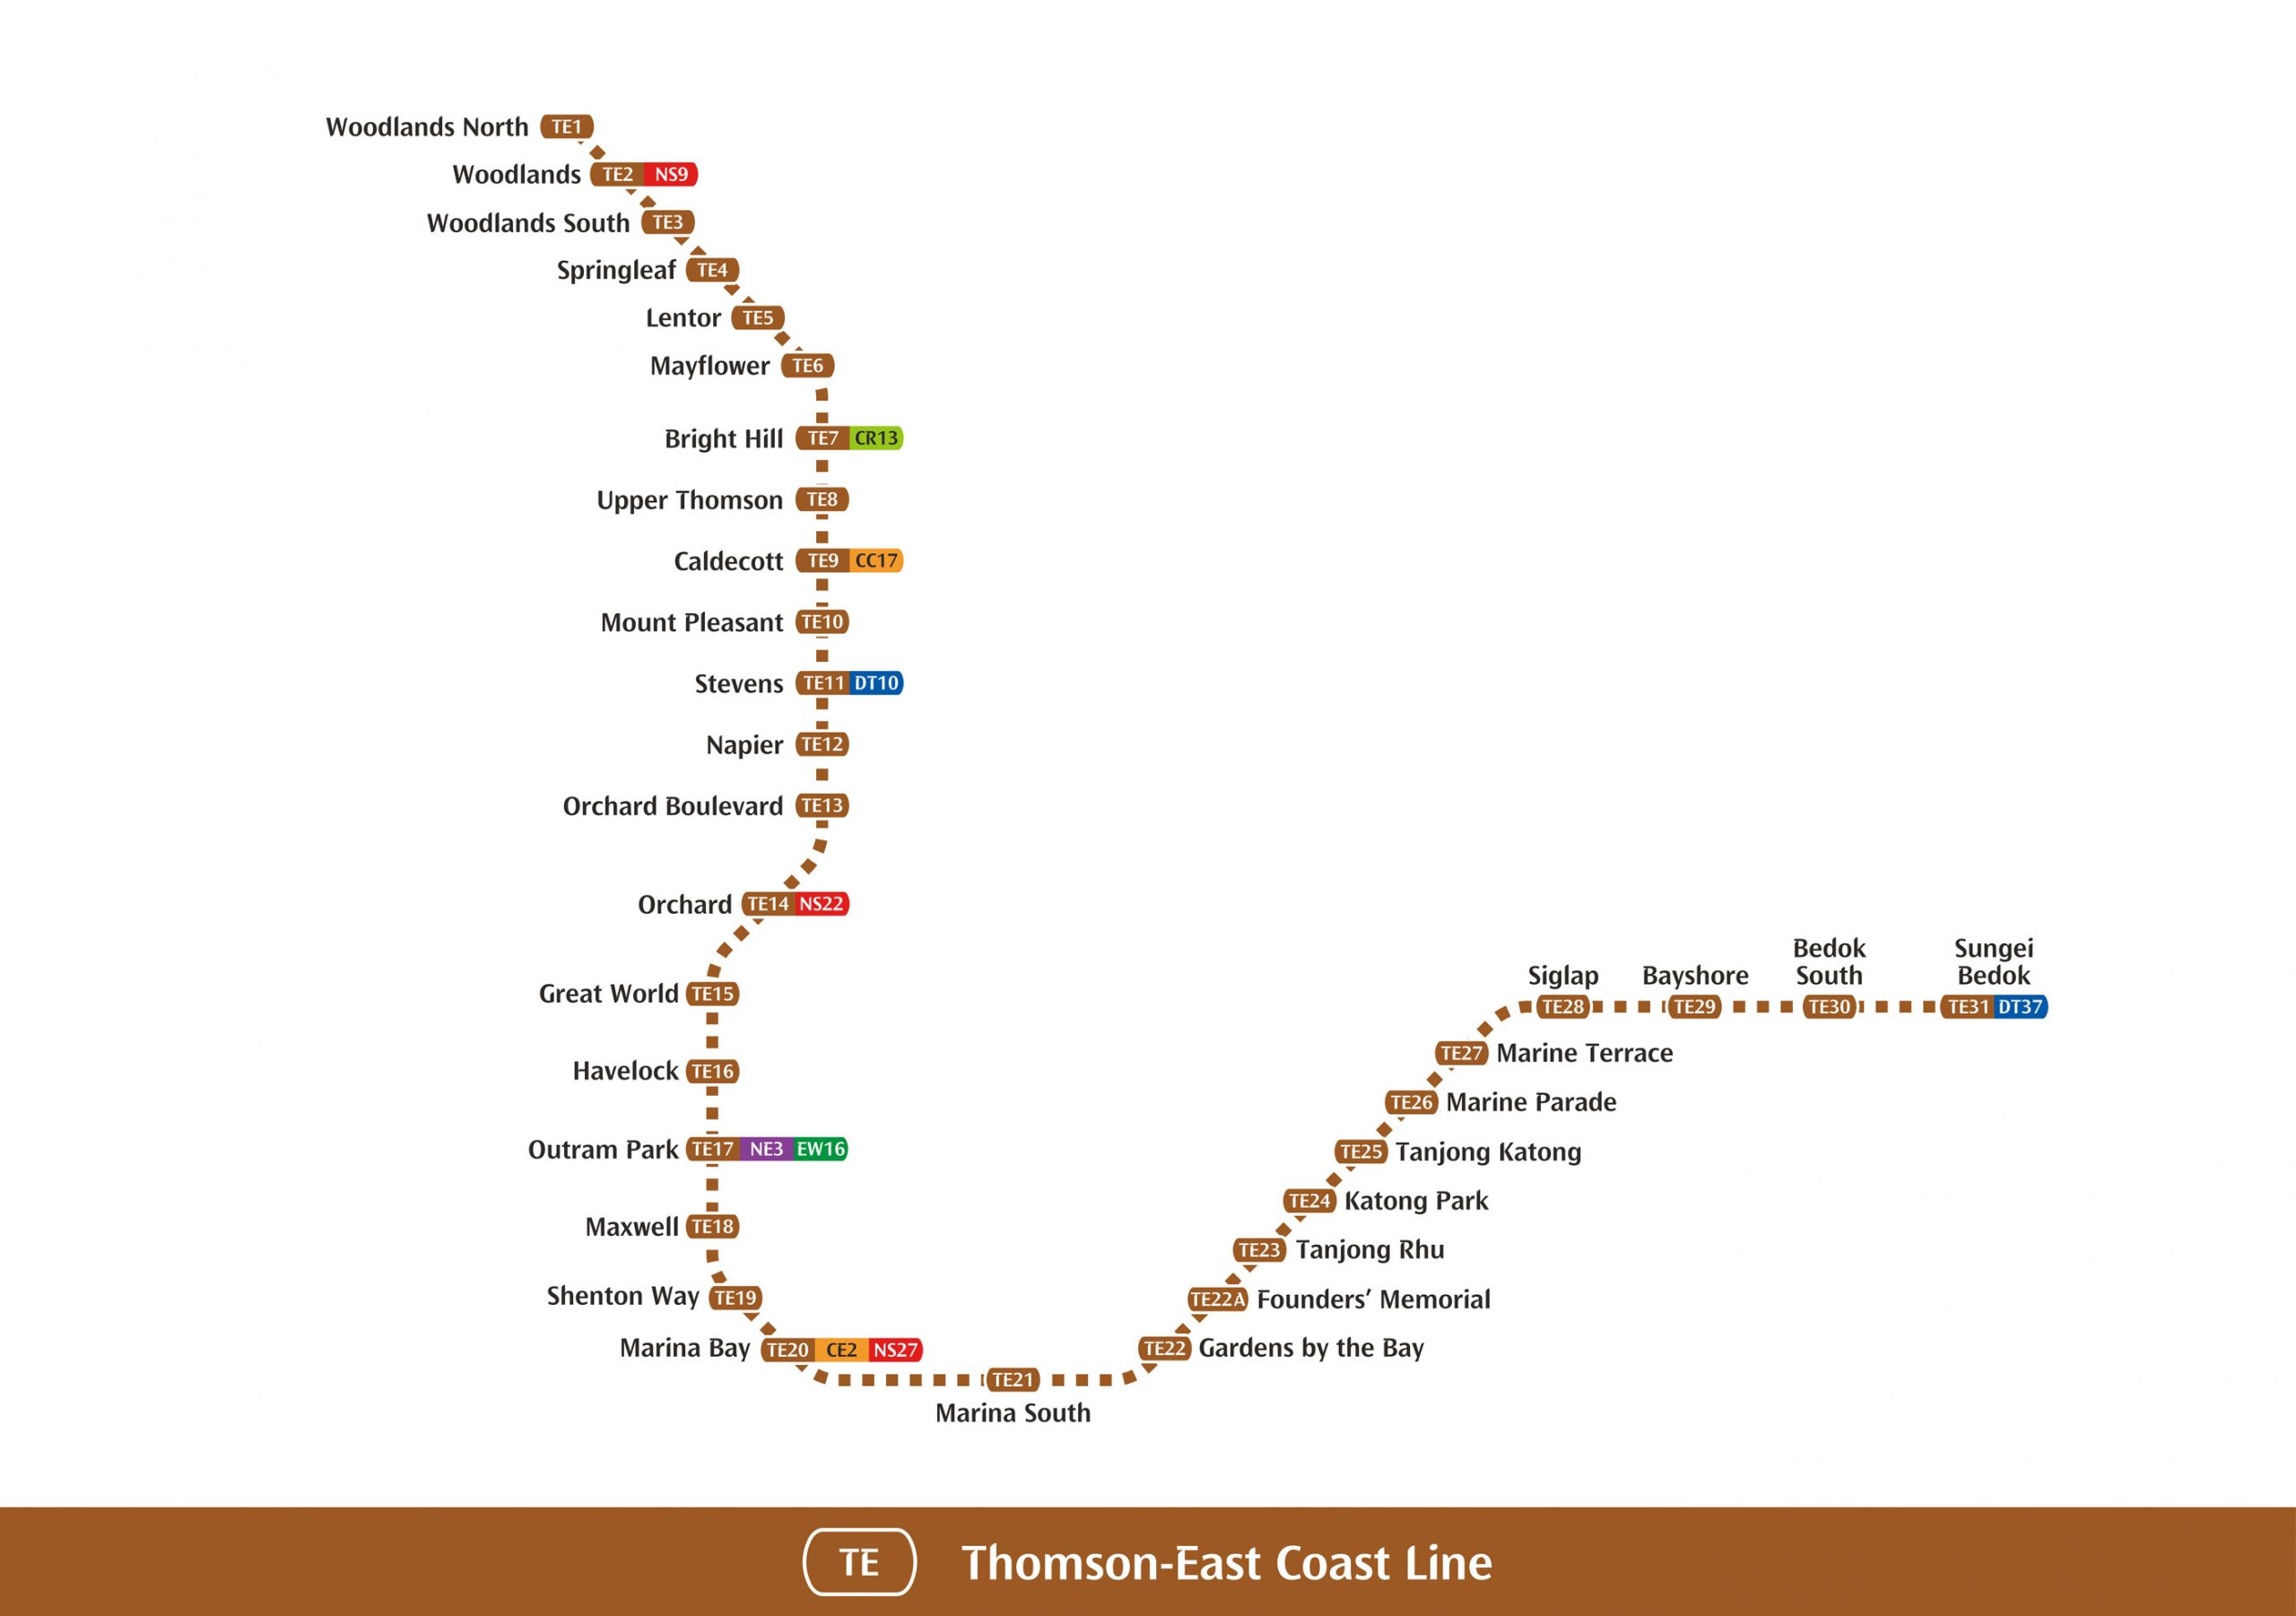
Thomson East coast line, TE23 Tanjong Rhu to TE29 Bayshore.
Project objectives
To find out how accessible MRT stations are from residential, commercial and educational institutions.
How long does it take to reach the MRT stations, in terms of walking speeds (first mile vs last mile)?
What is the socio-economic profile of residents residing along the TEL?
Scope of Work:
Generating of Iso-Areas as Polygons
In order to find the area that is within 5- 20 minutes of walking distance, we use the Iso-Area as Polygons Plugin. We did external research to gather information on the average walking speed of Singaporeans which is 4.4km/h, which we used as the speed to generate the Iso-Areas.
Using the Roads shapefile from Geofabrik OpenStreetMap, we filtered out all the walkable roads. Using this as our network layer, we are able to generate the Iso-Areas of the walking distance.
Primary Catchment Area Analysis (Walking distance)
We split our analysis based on three different datasets, Buildings and POIS layer from Geofabrik OpenStreetMap and Master Plan Land use of 2019. We chose these two main datasets as we wanted to look at the current land use as well as the future land use:
Buildings layer: Give us an idea about what kind of services and amenities are currently in the catchment area
The Master Plan Land Use layer: The future plans for these catchment areas and who else would the MRT potentially serve by the end of 2024.
POIS layer: Get to know what kind of additional services there are.
For both datasets,we delineated both maps using the Select by Location function to filter out only features that were within the Iso-Areas. As the buildings layer was irregularly shaped, we generated the centroids of the buildings instead to pick out the buildings in the Iso-area with greater ease.
Secondary Analysis (Cycling Distance)
As extra analysis, we generated the cycling time as well. The main difference of this Iso-Area is the speed we used, changing it to 16km/h.
We chose two MRT stations for this analysis:
TE25: Major residential area with many schools and different kind of landuse. Analysis on the cycling distance will allow us to learn more about what other facilities are accessible to residents staying further away.
TE28: From the initial analysis, we could tell that based on walking distance, it was only accessible for people that stayed in landed properties, hence we wanted to know whether taking cycling into consideration, could this MRT station reach a wider population that stays in other kinds of properties such as HDBs.
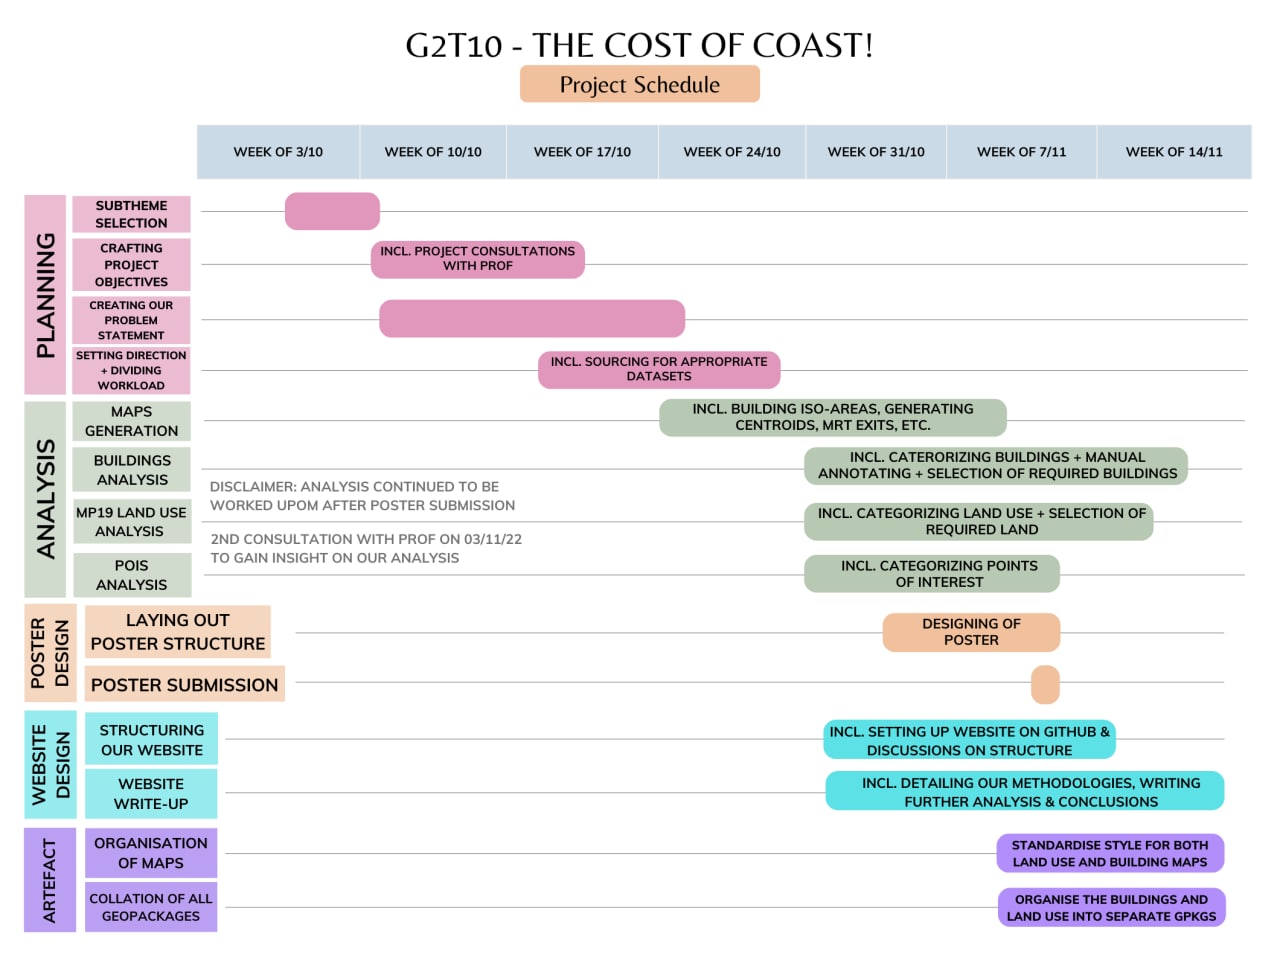
Project Timeline:
Team 10 Gantt Chart